Resources
DownloadMailing list
Web based forum
KProf project page
Welcome to the KProf homepage!
What is KProf ?
KProf is a visual tool for developers, which displays the execution profiling output generated by code profilers. The output of profilers being usually difficult to read (beyond the flat profile information), KProf presents the information in list- or tree-views that make the information very easy to understand.KProf provides access to the following features:
- Flat profile view displays all function / methods and their profiling information.
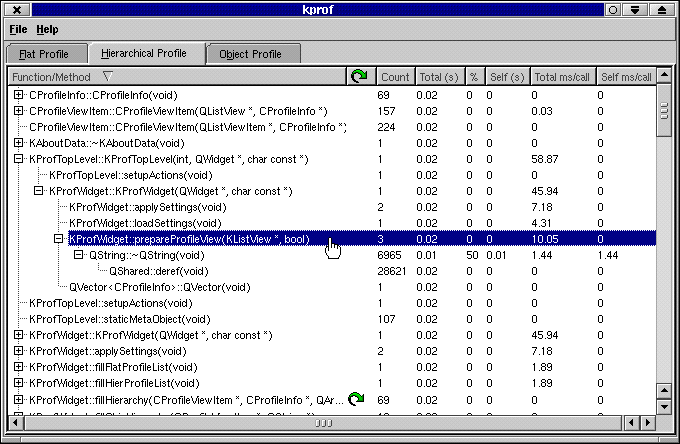
- Hierarchical profile view displays a tree for each function / method with the other functions / methods it calls as subelements.
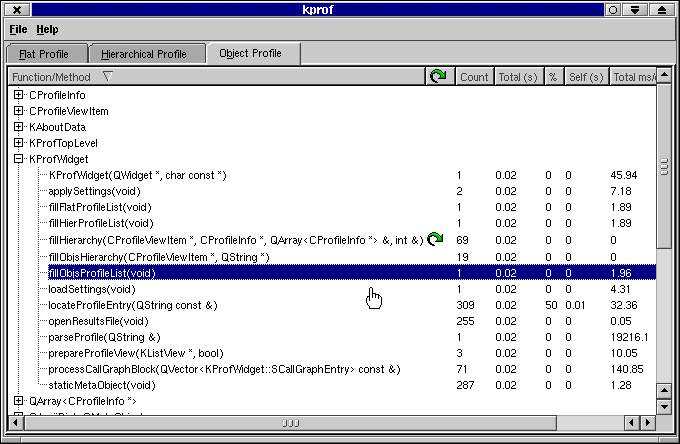
- Object profile view, for C++ developers, groups the methods in a tree view by object name.
- Graph view is a graphical representation of the call-tree, requires GraphViz to work.
- Method view is a more detailed look at an individual
method - cross referenced.
- Recursive functions carry a special icon to clearly show that they are recursive.
- Right-clicking a function or method displays a pop-up with the list of callers and called functions. You can directly go to one of these functions by selecting it in the pop-up menu.
- The flat profile view provides an additional filter edit box to filter the display and show only the functions or methods containing the text that you enter.
- Function parameters hiding if the function name is unique (i.e. no different signatures)
- C++ template abbreviation (template parameters can be hidden)
- Automatic generation of call-graph data for GraphViz and VCG, two popular graph image generators.
- Diff mode support to compare two profile results.
Supported profilers are:
- GNU gprof, the most commonly available profiler of unix platforms.
- Function Check, a recent and much better profiler for Unix using special GCC tricks.
- Palm OS Emulator (compiled with profiling turned on), which can generate execution profiling results for Palm OS applications.
KProf is distributed under the GPL license and is available in source code
form, for free.
Compilation & Installation
Once you have downloaded the KProf sources, do: % tar xvfz kprof-1.4.1.tar.gz
% cd kprof-1.4.1
% ./configure --prefix=(where KDE is installed, for example /opt/kde3)
% make
% su
enter your root password
# make install
The next time you start KDE, your K menu will have a KProf entry in the Development submenu (on some distributions, you may have to manually add KProf to the system menu).
Status - Septemeber 20, 2002
KProf 1.4.1 has been released. You can download it here. It is a KDE 3.x application. Here is the list of new features and changes:- Builds with GCC 3.2
- Now contains a HTML based call-graph display which is linked to a detailed method view
- Executable to profile and the profiler to use can now be specified
on the command line
Requirements
To compile KProf, you need the KDE 3.x development libraries and the corresponding Qt package. KDE ships with all up-to-date Linux distributions and free BSD systems. It should also compile on commercial Unices like Solaris and HP-UX. Note that this requirement only refers to the libraries KProf needs. It is not necessary to use any part of KDE. KProf should run fine with any window manager or desktop environment.Screenshots
The flat profile view

The hierarchical profile view

The object profile view

| KProf is copyright (c) 2000-2001 by Florent Pillet (c) 2002 Colin Desmond Email: cdesmond@users.sourceforge.net |